👉 As I was learning about data analysis and exploring opportunities in digital analytics, I created my very first dashboard using Looker Studio. While I’m still getting the hang of Google Analytics 4, I decided to use Universal Analytics to get started.
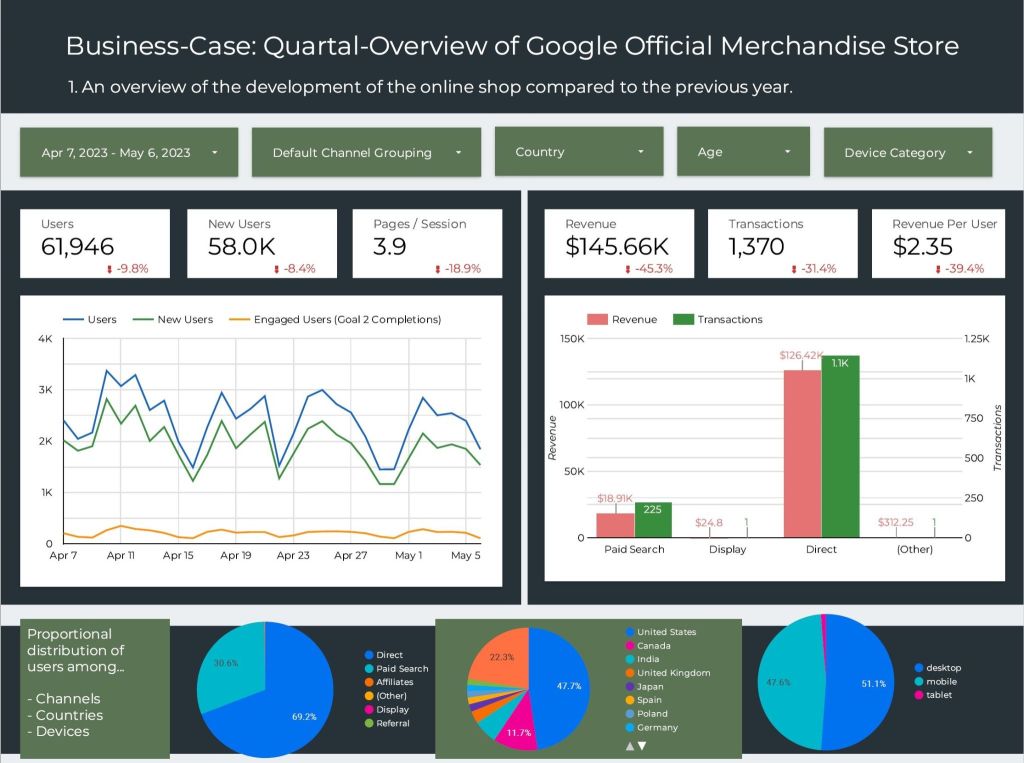
👉 As I built the dashboard, I focused on providing a comprehensive overview of the main trends, prioritizing revenue as it was for an online store. To track its growth, I compared the current year’s data with the previous year’s, avoiding a comparison with the previous quarter due to seasonal fluctuations.
👉 The dashboard also allows for identifying differences in each age group on every channel, in every country, and on every device. I prepared pie-charts on the first page to help understand the proportional distribution of users among channels, countries, and devices, which would help identify which channels are attracting more users.
🎉 Overall, creating this dashboard was an exciting step in my journey towards becoming a digital analyst, and I’m eager to continue learning and exploring new tools and techniques in the field.
🙏 Feel free to share your feedback!
Link: https://lnkd.in/epkz5iQx